|
We have multiple ways for you to access the normals. The interactive map allows you to access the normals for any station on the map by clicking on the station (additional instructions here). You may also search by a table list of stations with normals to view the data for individual stations. Directly access the 1991-2020 Provisional and Pseudo-normals for CoCoRaHS stations on the NCEI web site. Got to https://www.ncei.noaa.gov/access/us-climate-normals/. The search page is easy to use and there are instructions if you need help. Note that data is accessed using your station name, not station number. This list includes all U.S. Cooperative Network and CoCoRaHS stations. 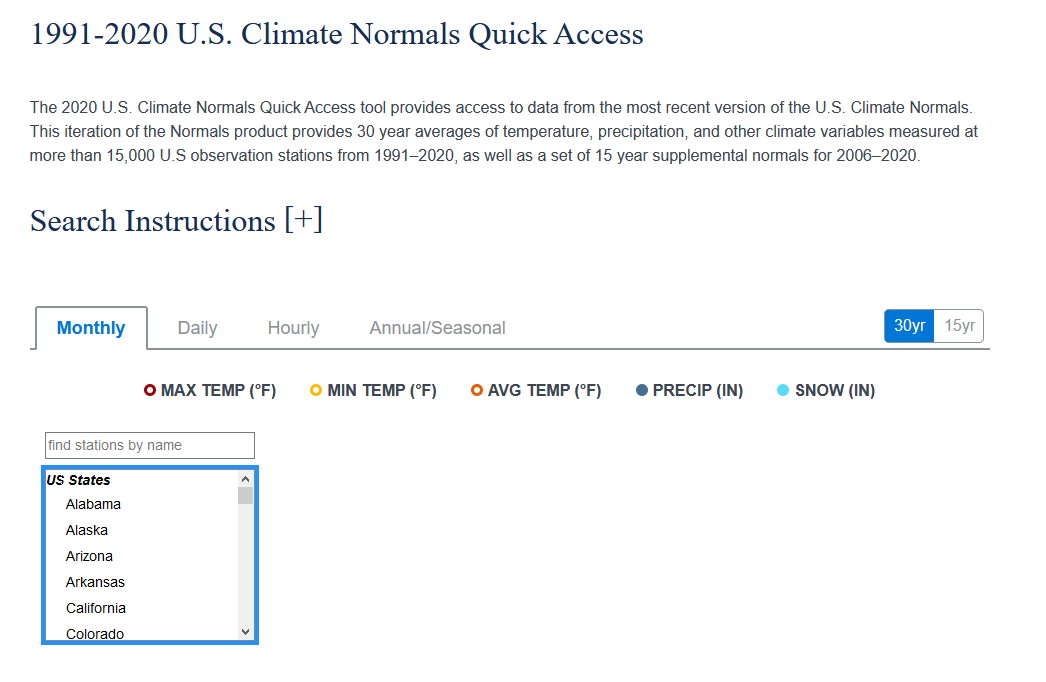
Data is aggregated on a monthly and seasonal basis. The data is both plotted and summarized in a table. If you have a sufficient amount of snow observations, the snow will plot and list along with the precipitation 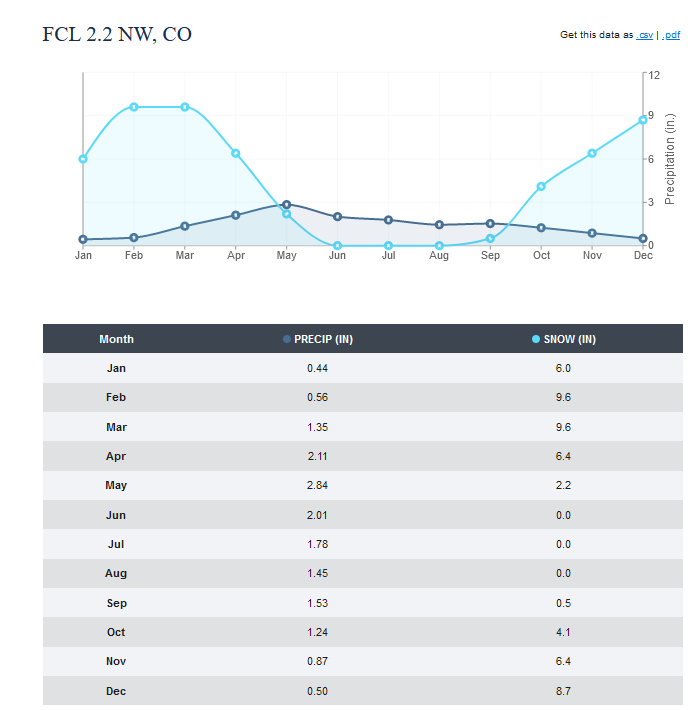
You can also download your data in a comma separated format (CSV) or PDF format. The CSV output will generally ask to open in an Excel file. If Pseudo-normals were calculated for the station, only the monthly means will be available. If the station has Provisional normals, the document contains the mean number of days for different precipitation thresholds and monthly precipitation probabilities. These values are something that has not ever been available to CoCoRaHS observers before. Example of data for a Pseudo-normal station 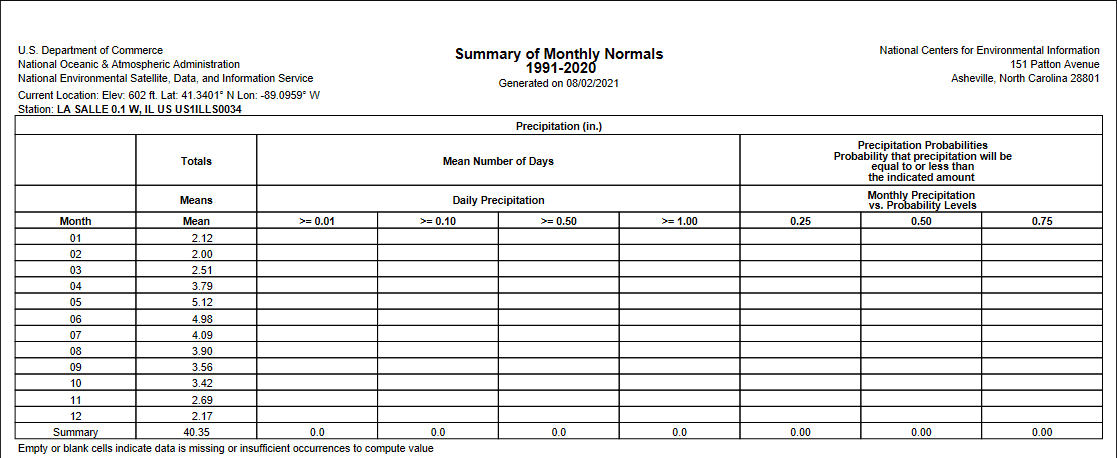
Example of data for a Provisional normal station 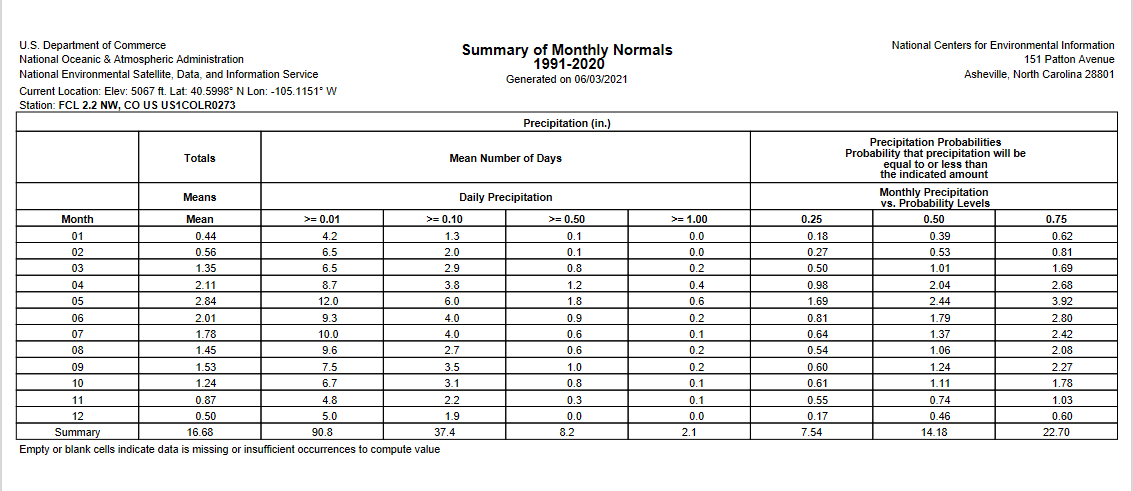
|