|
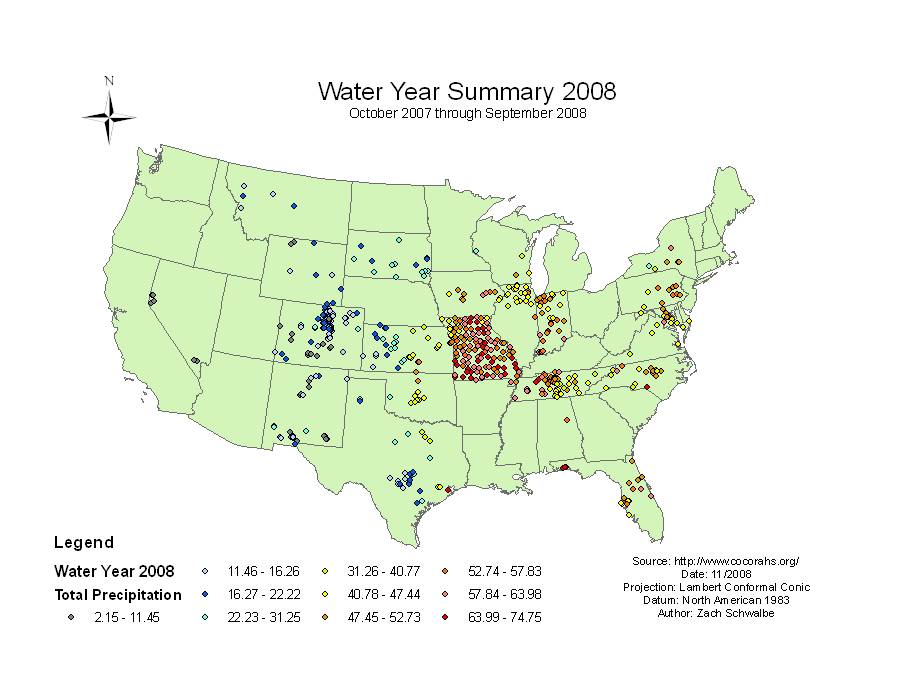
CoCoRaHS 2008 Water Year Summary
(October 2007 through September 2008)
| |
|
|
Days with Precipitation |
|
Water Year Precipitation Totals |
|
Snow Maximums |
| |
|
|
|
| Alabama |
3 |
|
97 |
130 |
|
42.51 |
AL-LS-2 |
|
53.04 |
AL-TG-3 |
|
5.8 |
AL-CH-3 |
| Colorado |
108 |
|
47 |
189 |
|
7.51 |
CO-ME-13 |
|
43.67 |
CO-GN-18 |
|
524.5 |
CO-GN-18 |
| Florida |
17 |
|
74 |
130 |
|
41.58 |
FL-PN-8 |
|
72.65 |
FL-OK-2 |
|
0.0 |
|
| Illinois |
24 |
|
133 |
162 |
|
37.96 |
IL-SK-1 |
|
59.03 |
IL-SC-3 |
|
94.1 |
IL-LK-3 |
| Indiana |
31 |
|
117 |
176 |
|
41.77 |
IN-HT-1 |
|
64.67 |
IN-HS-5 |
|
96.2 |
IN-LP-7 |
| Iowa |
16 |
|
86 |
200 |
|
44.87 |
IA-ST-3 |
|
59.19 |
IA-BT-1 |
|
81.2 |
IA-BT-1 |
| Kansas |
36 |
|
63 |
153 |
|
11.55 |
KS-SW-4 |
|
54.05 |
KS-JO-8 |
|
42.6 |
KS-RA-9 |
| Maryland |
11 |
|
128 |
168 |
|
40.57 |
MD-DR-1 |
|
59.73 |
MD-PG-1 |
|
84.7 |
MD-GR-4 |
| Michigan |
1 |
|
|
|
|
|
|
|
46.35 |
MI-BN-2 |
|
84.2 |
MI-BN-2 |
| Missouri |
121 |
|
96 |
141 |
|
36.74 |
MO-WH-1 |
|
74.75 |
MO-FSA-171 |
|
48.0 |
MO-WH-1 |
| Montana |
5 |
|
100 |
185 |
|
12.08 |
MT-LK-5 |
|
21.96 |
MT-MS-1 |
|
199.5 |
MT-SN-2 |
| Nevada |
6 |
|
38 |
74 |
|
2.15 |
NV-CK-20 |
|
7.21 |
NV-WH-55 |
|
61.6 |
NV-WH-19 |
| New Mexico |
32 |
|
43 |
104 |
|
6.09 |
NM-BR-13 |
|
28.05 |
NM-OT-39 |
|
105.5 |
NM-CL-1 |
| New York |
6 |
|
139 |
258 |
|
30.42 |
NY-ST-5 |
|
68.36 |
NY-OD-2 |
|
187.5 |
NY-OD-2 |
| North Carolina |
17 |
|
115 |
187 |
|
36.50 |
NC-AV-1 |
|
70.55 |
NC-SC-1 |
|
26.8 |
NC-WH-15 |
| Oklahoma |
10 |
|
69 |
102 |
|
23.14 |
OK-BC-2 |
|
48.24 |
OK-NB-1 |
|
16.1 |
OK-GT-1 |
| Pennsylvania |
11 |
|
142 |
218 |
|
42.39 |
PA-BD-5 |
|
54.31 |
PA-BR-2 |
|
93.7 |
PA-CM-1 |
| South Dakota |
15 |
|
118 |
168 |
|
17.71 |
SD-MD-9 |
|
29.03 |
SD-MH-20 |
|
199.4 |
SD-LW-6 |
| Tennessee |
52 |
|
115 |
152 |
|
37.29 |
TN-RD-12 |
|
69.66 |
TN-BN-1 |
|
23.2 |
TN-UC-4 |
| Texas |
30 |
|
64 |
122 |
|
12.00 |
TX-DL-1 |
|
67.43 |
TX-GV-4 |
|
21.3 |
TX-DL-1 |
| Virginia |
5 |
|
100 |
162 |
|
32.34 |
VA-MN-5 |
|
58.96 |
VA-FX-33 |
|
12.3 |
VA-FD-3 |
| Wisconsin |
5 |
|
120 |
159 |
|
29.61 |
WY-PC-1 |
|
48.72 |
WI-JF-3 |
|
129.9 |
WI-OZ-1 |
| Wyoming |
9 |
|
82 |
111 |
|
5.60 |
WY-PK-11 |
|
21.65 |
WY-LM-23 |
|
268.5 |
WY-LN-2 |
This summary consists of all the Water year summaries without a missing daily report starting October 1st 2007 and ending September 30th, 2008. There were a total of 571 summaries without a missing daily report through the Water Year, however we received many more Water Year summaries from our observers around the country. We thank all of you for participating in CoCoRaHS and making "Every Drop Count!"
Although we had 37 states as part of the CoCoRaHS Network at the end of the water year, we only had 23 states at the beginning of the water year.
Download data as an Excel file.
Download data as a KMZ file.
|